02 — Map editor
A cartographic editor where you do not draw borders — you query them. Choose a date and the political map of that day appears; then style it, annotate it, attach data and share it.
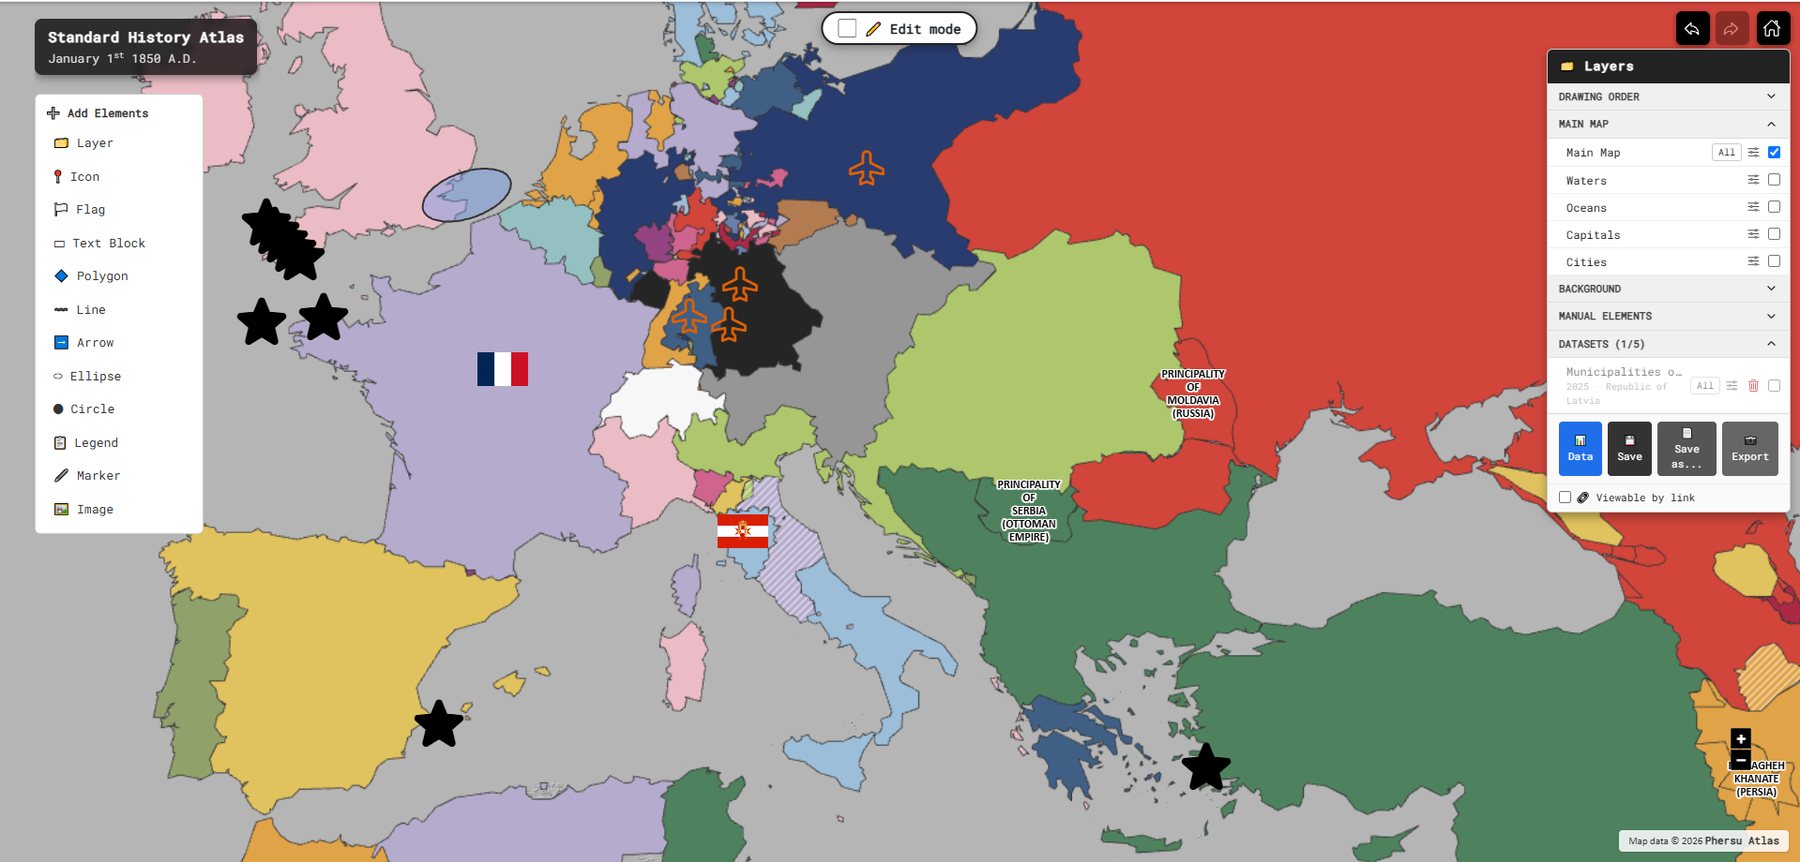
The 2D editor on 1 January 1850: Add Elements on the left, Layers and datasets on the right, Edit mode at the top.

Developed together with Sapienza Università di Roma and used in its history courses, where students set up, edit, enrich and share historical maps.
A cartographic editor built on historical data. Select a date and the political geography of that day appears. Style it, annotate it, enrich it with data, and share it.
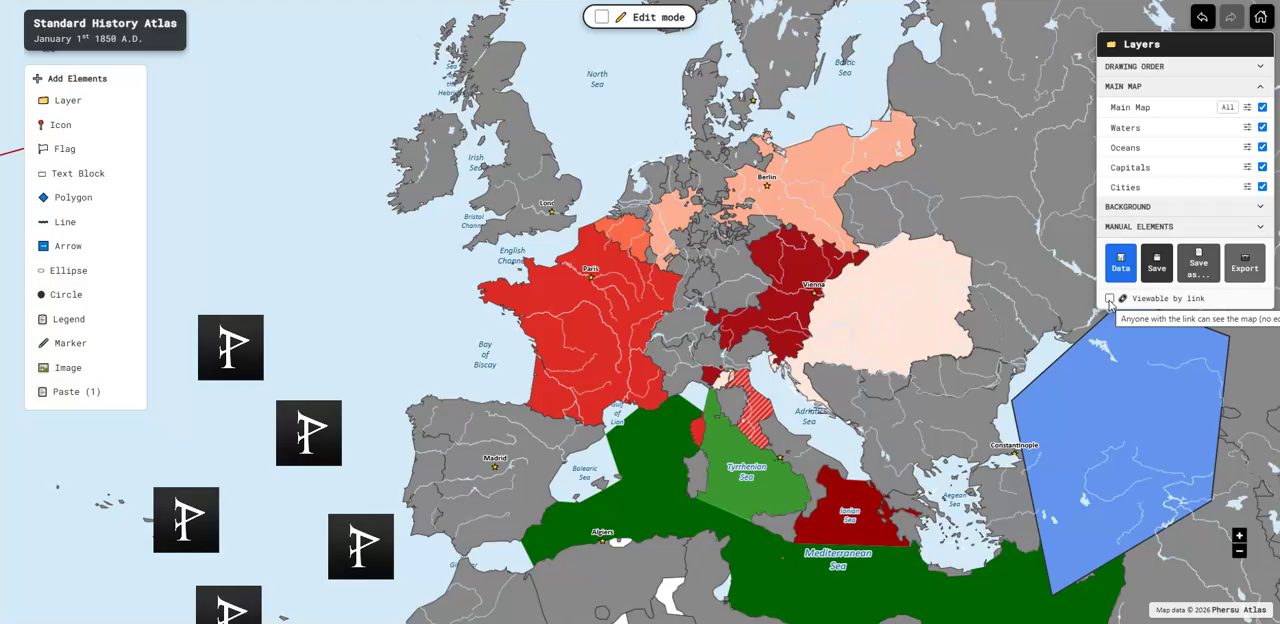
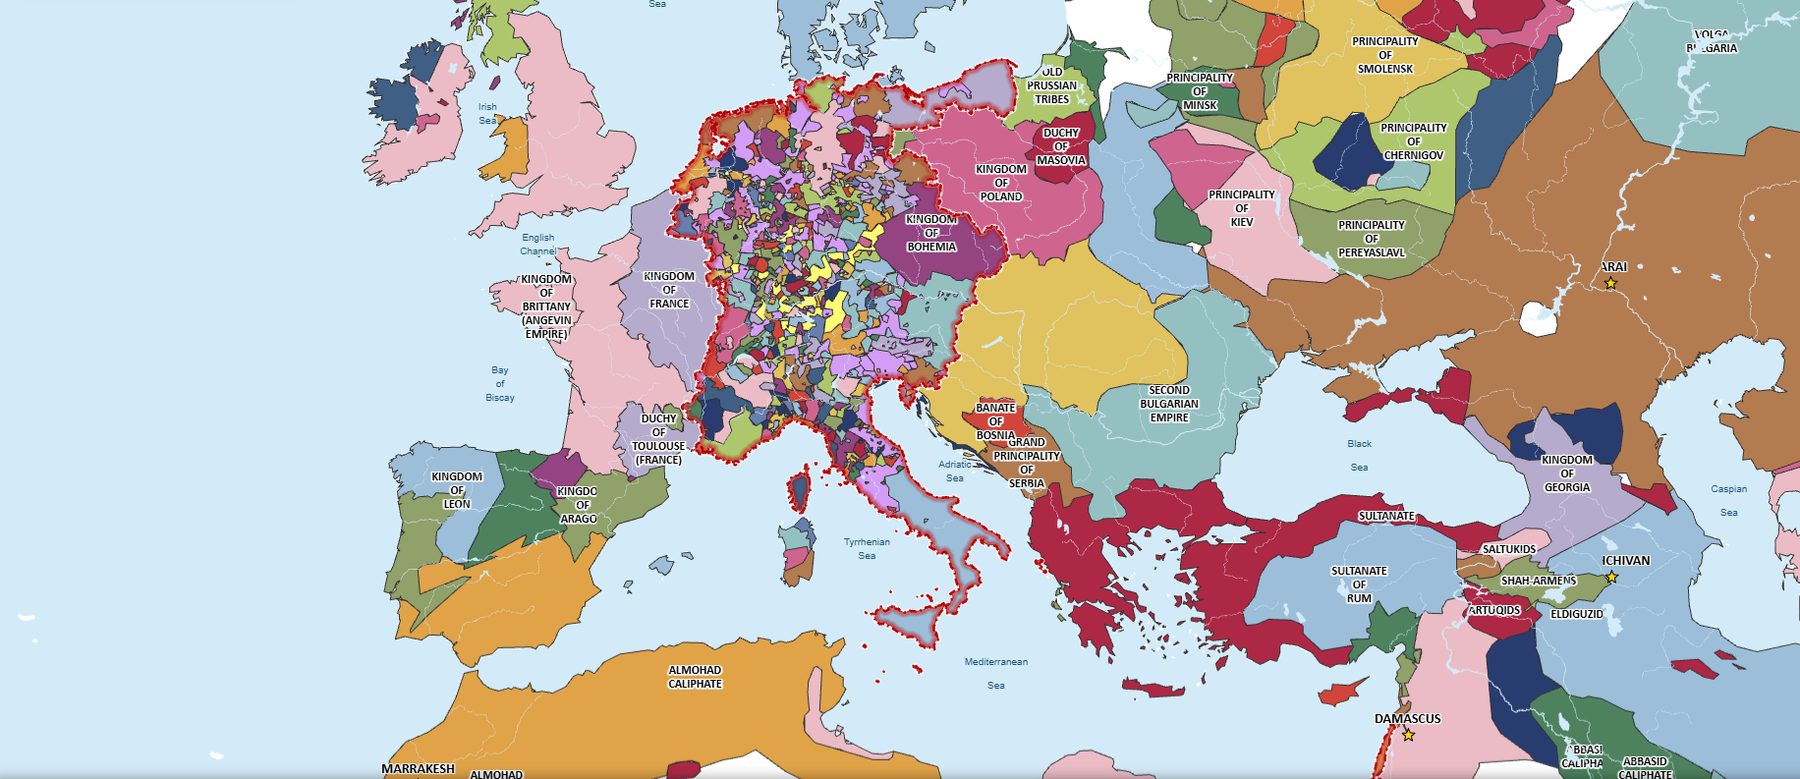
GeoPolMaps is a cartographic editor derived from the historical model of Phersu Atlas. Rather than relying on static layers, it works with political entities defined in time and connected to events and territorial changes. Every map is generated from the underlying database: select a date and the borders valid for that day appear automatically. Styles, colours and annotations can then be added while remaining distinct from the historical data.
The guiding principle is continuity from source to map. Historical sources become structured data, and data becomes visualisations. This helps prevent common errors in historical cartography, such as anachronistic borders or states that did not yet exist, or no longer existed, at the selected date.
Three choices come first, always in the same order: a style (Standard, Old Style, Transparent, Dark), a date — any day from 1 January 3499 BC to today — and a projection (Mercator, Equal Area Cylindrical or Polar Stereographic North). Then the editor opens.
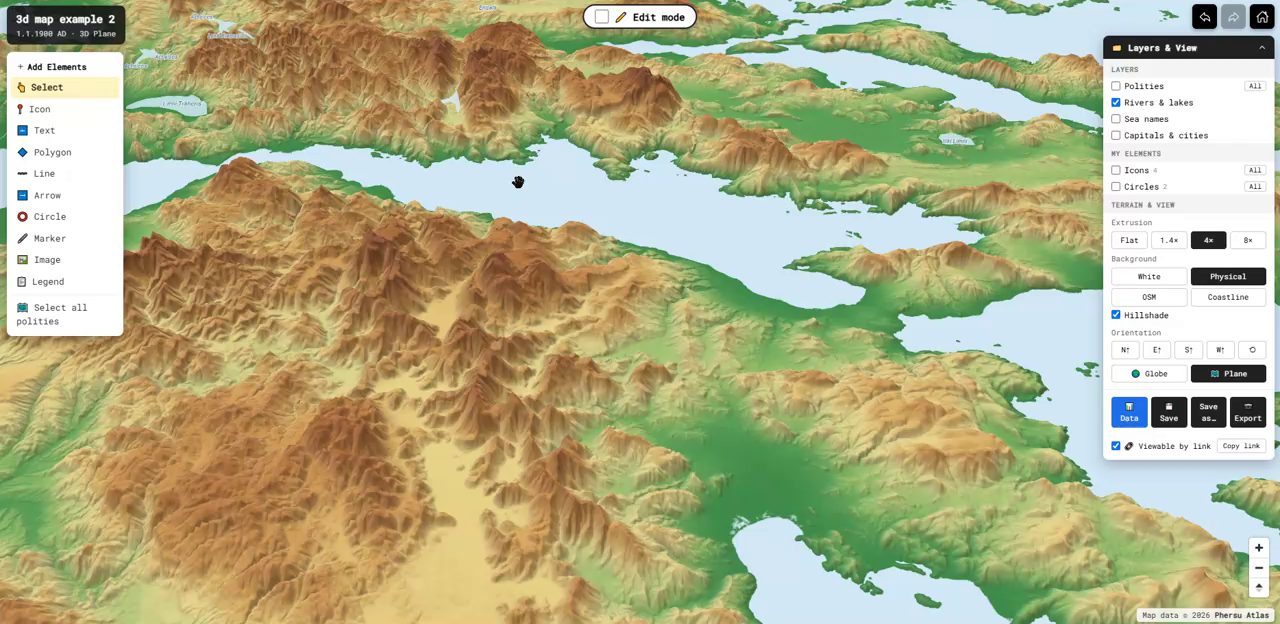
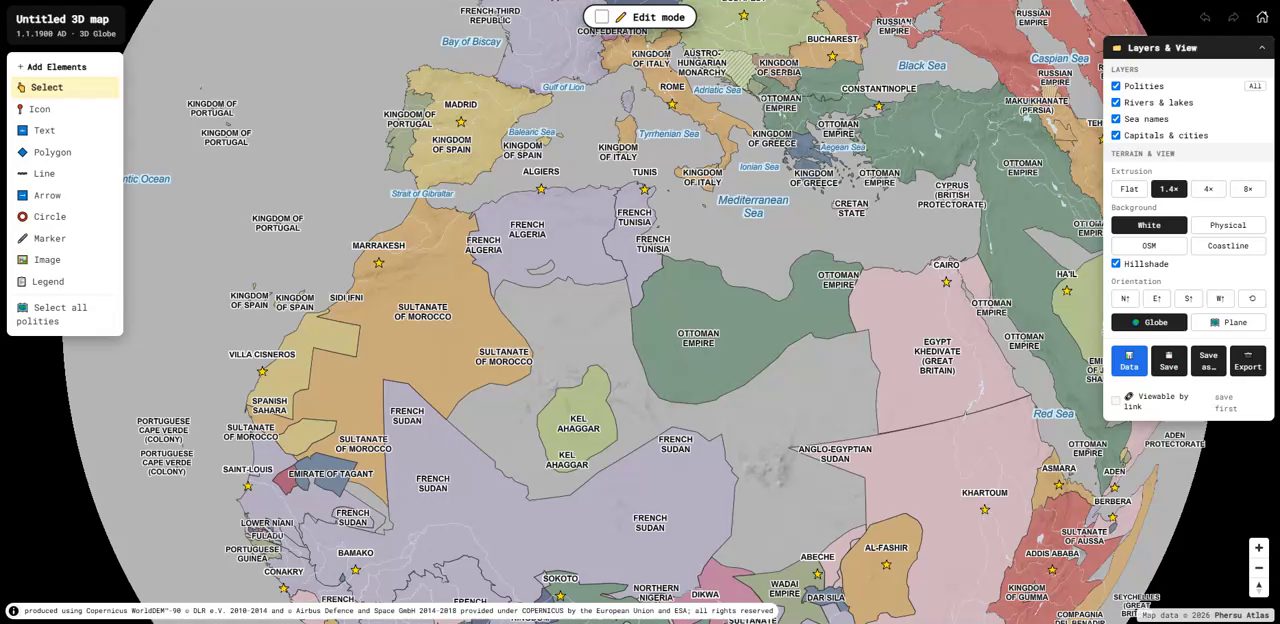
About ninety percent of the functions are shared with the 2D editor. The 3D editor adds a globe or a plane with real relief, hillshading, four orientations (look at the Mediterranean “from the south”) and relief exaggeration up to 8×, so physical geography and political borders can be read together.
GeoPolMaps is currently in use at Sapienza Università di Roma and is not yet released to the public. Universities, research centres and publishers interested in using the editor can contact us for institutional access.