01 — Flagship project
Explore 5,500 years of political history, day by day. Pick any date and see the political map of the world exactly as it was.
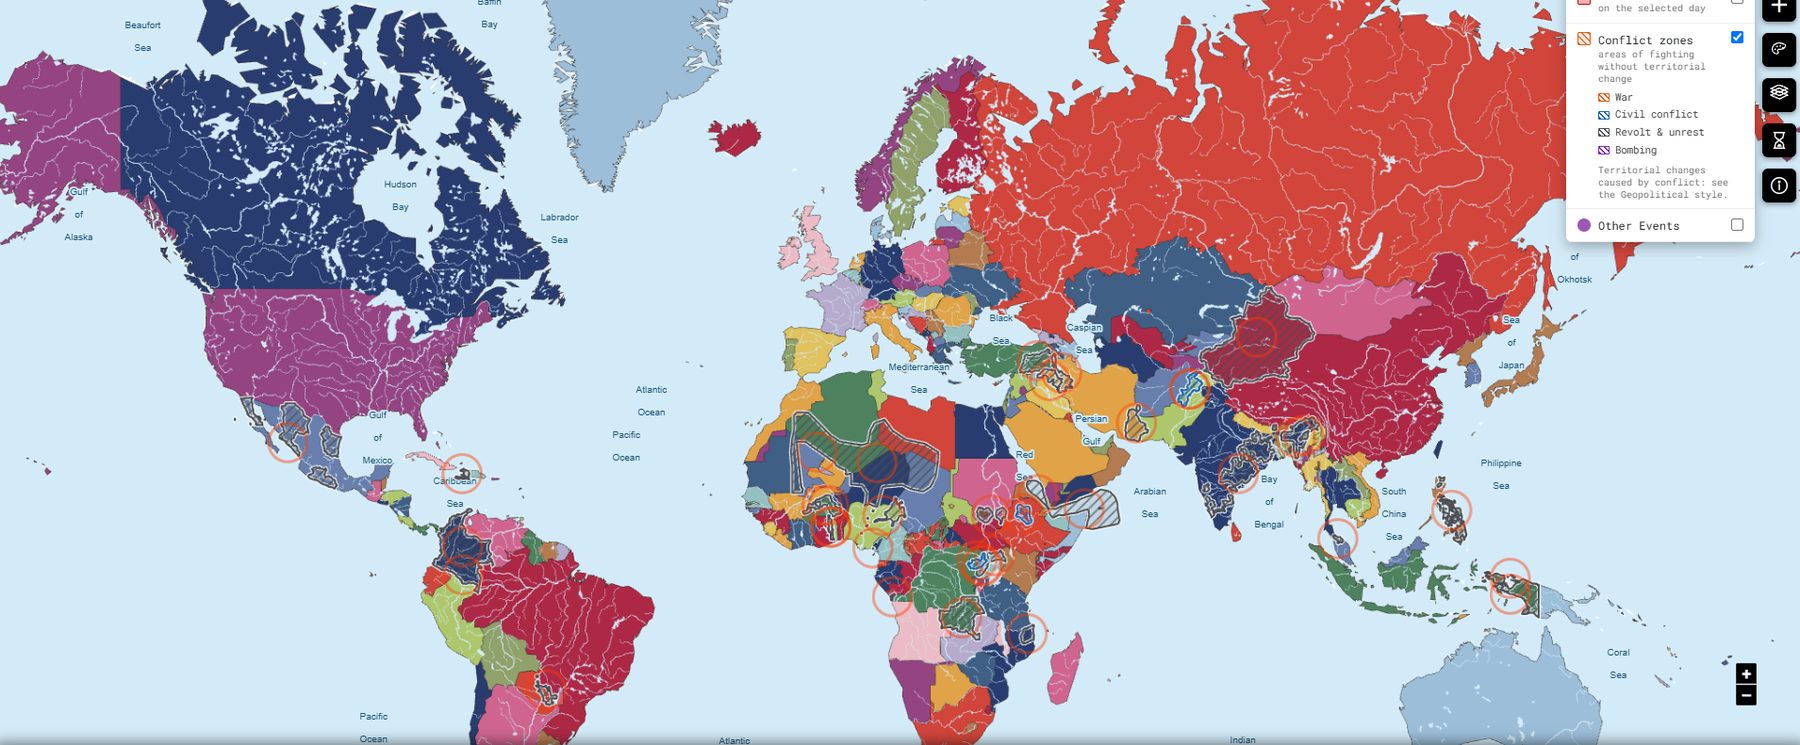
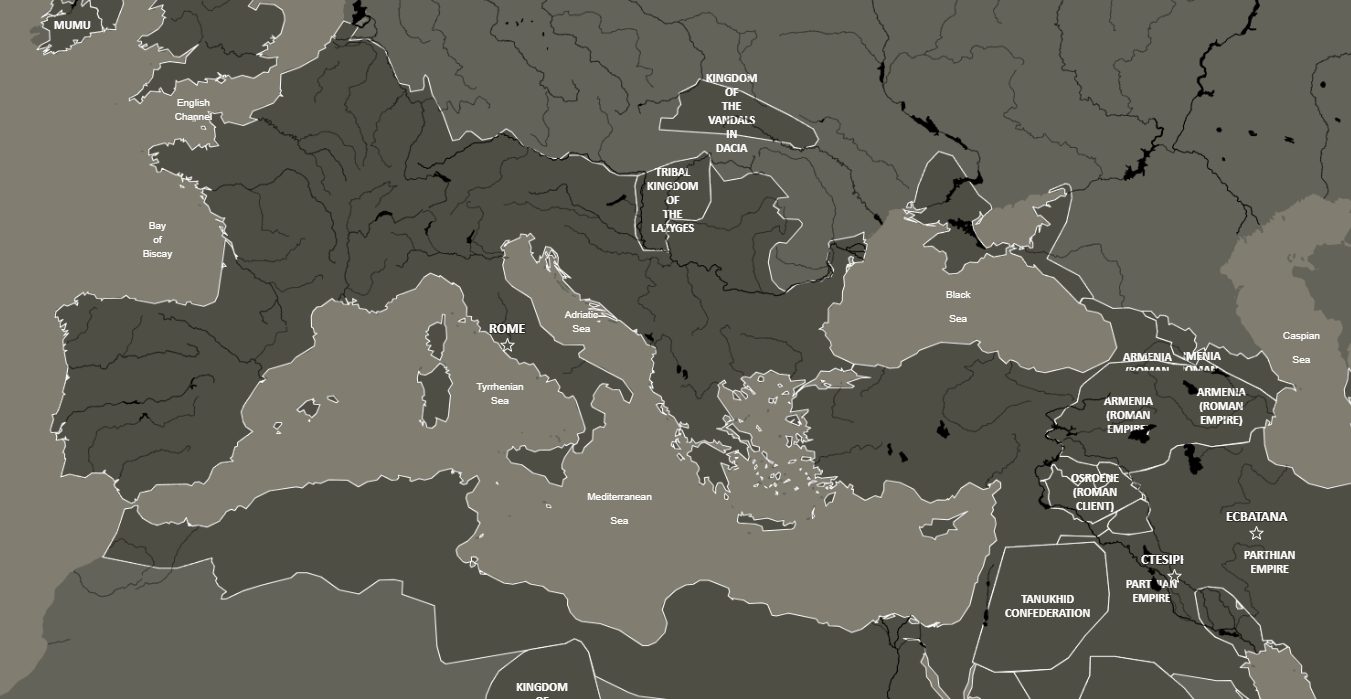
Standard style with the Conflict zones layer: wars, civil conflicts, revolts and bombings as hatched areas.
Phersu Atlas is an interactive historical atlas that shows how the political map of the world changed day by day, from 3499 BC to the present. Behind the map lies a database of around 8,000 polities, including states, empires, kingdoms, city-states and other political entities, together with their rulers, capitals, cities, battles, territorial changes and statistics.
The atlas always displays a single date. Everything on the screen, including borders, coastlines, capitals, cities and battles, refers to that specific day. Borders are not drawn period by period but generated from a continuous historical model, meaning that a map of 1453 and a map of 1815 are derived from the same underlying dataset.
A style decides how the map looks. Five styles share exactly the same data and differ only in look or projection; three thematic styles use specific colours or modified data to answer a particular question.
| Style | Main characteristic |
|---|---|
| Standard | Full colours; the historical coastline of the selected day as background |
| Old Style | Muted colours like an old printed atlas; black capitals and cities |
| Equal Area Cylindrical | Equal-area projection: surfaces in true proportion |
| Polar Stereographic North | Polar projection of the northern hemisphere |
| Transparent Background | Modern street map behind transparent polygons, to compare past and present borders |
| German Confederations | Imperial and ecclesiastical territories of the Holy Roman Empire and later confederations, outlined in red |
| Indian Treaties | North America: Western powers only on the territory they effectively controlled |
| Geopolitical | Highlights polities with recent territorial change; arrows for the changes of the last month |
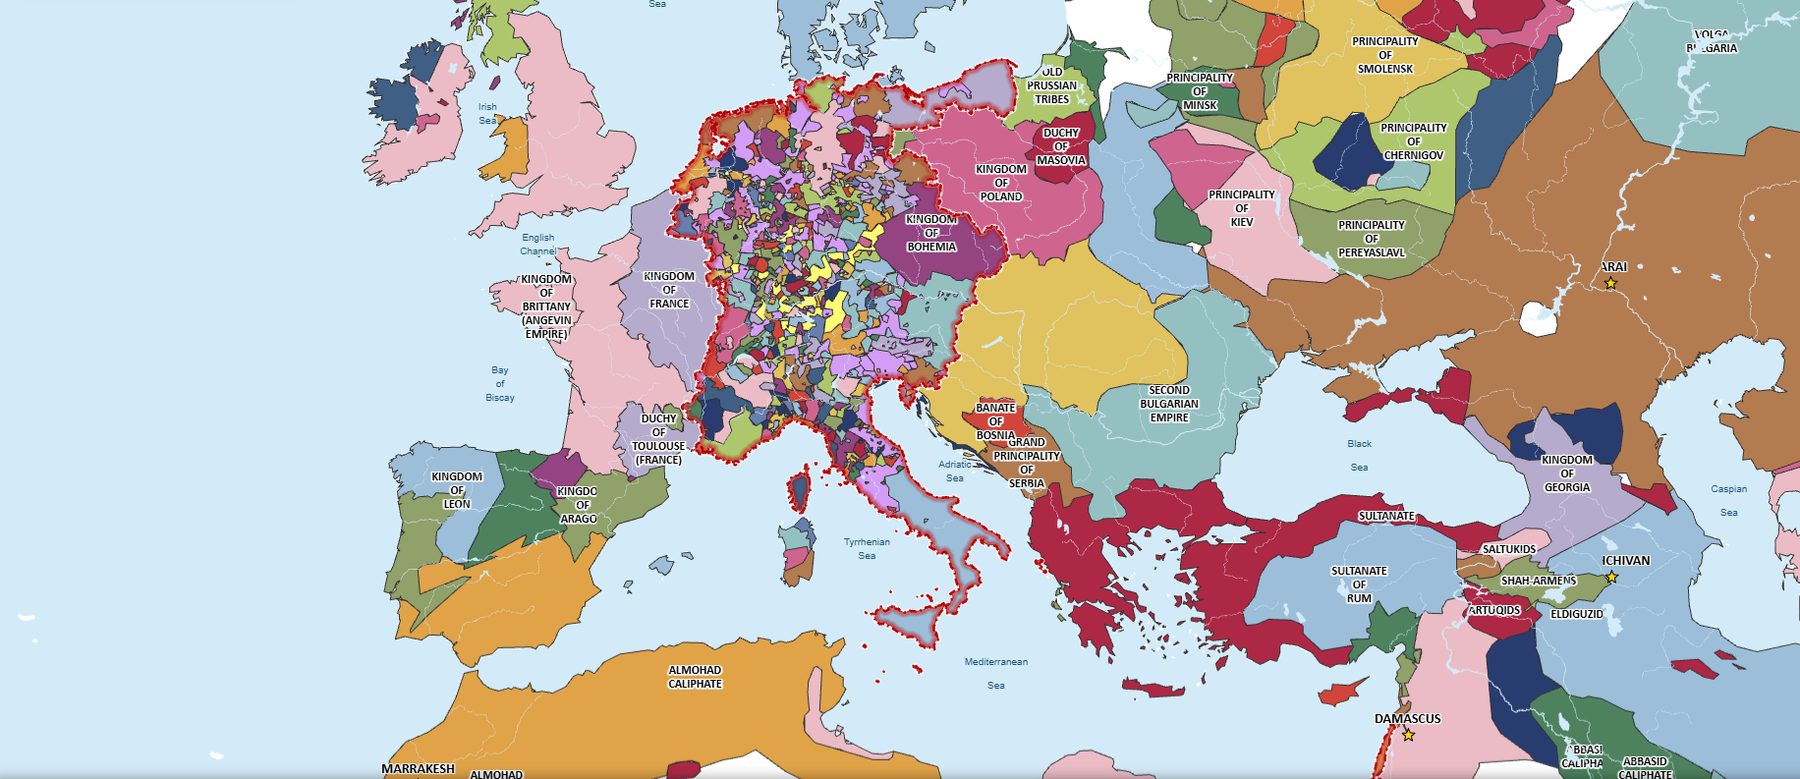
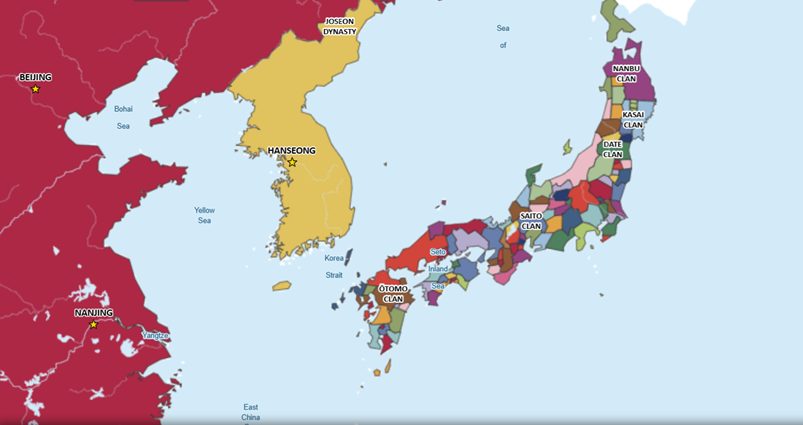
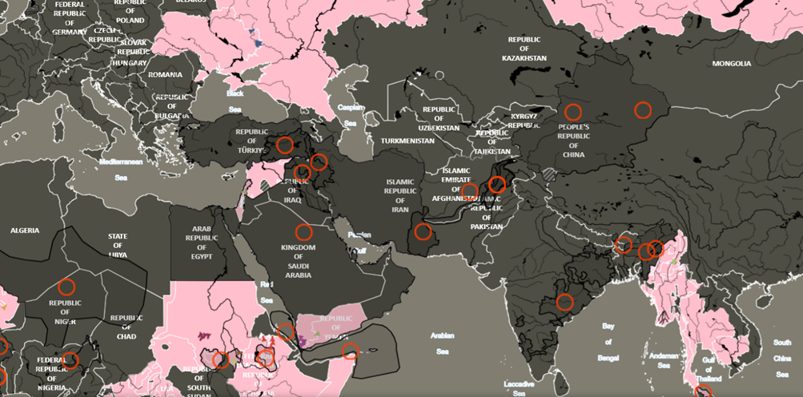
Answers a simple question: “Which states existed in these locations on this date?” Place markers on the map and discover which polity governed each location. It is particularly useful for tracing where your ancestors lived or identifying the historical states associated with places at a given moment in time.
Follow a war, a polity or a nation through all of its territorial changes, one after the other, with each change explained.
Data-driven pages, always per year or per period: how borders shift and how long polities last; invasion comparisons; historical population atlases and projections; rankings of nations, polities and wars by changes, wars, area or population; global statistics; and a generative-AI Map Generator that creates maps from a text description.